Maintenance & reliability
MTBF and MTTR: what they mean, how to calculate them and how they relate to OEE
What MTBF and MTTR mean, the MTBF and MTTR formulas, the difference from MTTF, a worked example, the availability formula and the link to OEE.
Volkan Alkılıç ·
Our clients
- Siemens

- Anadolu Isuzu

- BSH
- Tofaş

- Toyotetsu

- Martur

- Turkcell

- Vodafone

- Doğadan

- Pakmaya

- Bross

- Abdi İbrahim

- Nobel İlaç

- Plastimak

- Dalgıç Kalıp

- Barbaros Motor

- Magneti Marelli

- Rözmaş

- Sanel


MTBF (Mean Time Between Failures) shows how long a machine runs on average between two failures; MTTR (Mean Time To Repair) shows how long it takes on average to repair it and get it running again. MTBF = total run time / number of failures, and MTTR = total repair time / number of repairs. MTBF tells you how reliable the machine is; MTTR tells you how quickly failures are fixed.
This guide covers what MTBF and MTTR mean, how to calculate them, how they differ from MTTF, a worked example, machine availability and how both relate to OEE. The final sections show how to track them in Excel and the calculation mistakes we see most often on the shop floor.
MTBF and MTTR definitions
| Abbreviation | Stands for | What it measures |
|---|---|---|
| MTBF | Mean Time Between Failures | How often failures happen |
| MTTR | Mean Time To Repair | How long it takes to fix a failure |
| MTTF | Mean Time To Failure | The life of a part that is not repaired |
The “R” in MTTR means Repair in some sources and Restore or Recover in others. The distinction changes the calculation: it decides whether you count only the time spent repairing, or the whole time until the machine is back in production. We come back to this in the mistakes section.
How to calculate MTBF
MTBF = Total run time / Number of failures
Total run time is the time the machine actually ran during the period you are looking at. Time spent stopped because of failures is not included. The number of failures is the count of failures that stopped the machine in the same period.
The higher the MTBF, the longer the machine runs between failures. A falling MTBF can point to a wearing part, a wrong setting, a gap in the maintenance plan or a change in operating conditions.
How to calculate MTTR
MTTR = Total repair time / Number of repairs
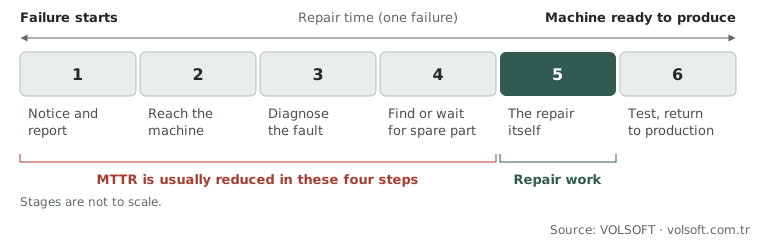
Repair time runs from the moment the failure starts until the machine is ready for production again. It is made up of several stages:
- The failure is noticed and reported to maintenance,
- The maintenance technician reaches the machine,
- The fault is diagnosed,
- The spare part is found or waited for,
- The repair itself,
- Testing and handing the machine back to production.
Use this diagram
You may use this diagram free of charge on your site, in training or in presentations, as long as you credit and link the source. The code below does both.
The way to bring MTTR down usually lies in the first four steps, not the fifth. A failure reported late, a technician who can only start investigating once at the machine, or a spare part that is not in stock can take longer than the repair itself. Recording the stages of MTTR separately shows where the delay actually happens.
What is MTTF and how does it differ from MTBF?
MTBF and MTTR are for repairable equipment: the machine fails, is repaired and runs again. For parts that are replaced rather than repaired, such as bearings, sensors, fuses or belts, you use MTTF:
MTTF = Total operating time of the parts / Number of failed parts
For example, if four sensors of the same type failed after 8,000, 10,000, 12,000 and 14,000 hours, MTTF = (8,000 + 10,000 + 12,000 + 14,000) / 4 = 44,000 / 4 = 11,000 hours. This is a starting point for spare-part stock and planned replacement intervals.
MTBF and MTTR calculation example
The figures below are hypothetical values chosen to show the calculation.
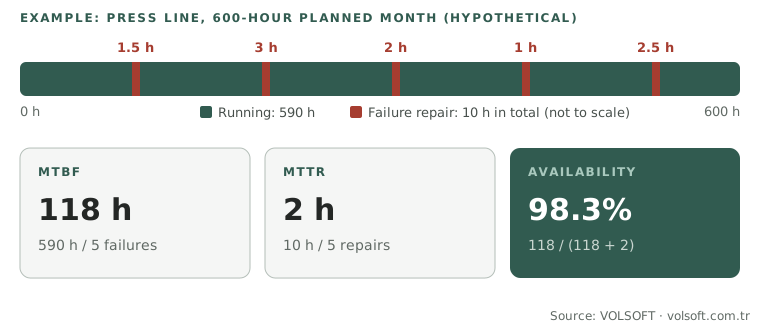
A press line is planned for 600 hours of production in a month. During the month the machine failed 5 times, and the repairs took 1.5 hours, 3 hours, 2 hours, 1 hour and 2.5 hours.
1. Total repair time: 1.5 + 3 + 2 + 1 + 2.5 = 10 hours
2. Total run time: 600 − 10 = 590 hours (in this example we assume there were no stops other than failures)
3. MTBF: 590 / 5 = 118 hours
4. MTTR: 10 / 5 = 2 hours
So the machine runs for 118 hours on average between failures, and each failure takes 2 hours on average to fix.
Use this diagram
You may use this diagram free of charge on your site, in training or in presentations, as long as you credit and link the source. The code below does both.
Availability from MTBF and MTTR
The formula that combines the two gives the equipment’s availability with respect to failures (in the literature, “inherent availability”):
Availability = MTBF / (MTBF + MTTR)
In our example: 118 / (118 + 2) = 118 / 120 = 98.3%
Check: the machine ran for 590 of the 600 planned hours, and 590 / 600 = 98.3% gives the same result. The formula weighs the two things that drive availability together: the average time between failures (MTBF) and the average repair time (MTTR). The same availability can come from frequent short failures or from rare long ones, and the way to improve each is completely different.
MTBF, MTTR and OEE
OEE also contains an availability rate, but the two availabilities are not the same thing:
| Availability from MTBF/MTTR | OEE availability | |
|---|---|---|
| Which stops count | Failures only | Every stop within planned time: failures, setups, mold changes, material waits, operator absence |
| Whose metric | Maintenance | Production |
| The question it answers | How reliable is the machine? | How much of the planned time was spent producing? |
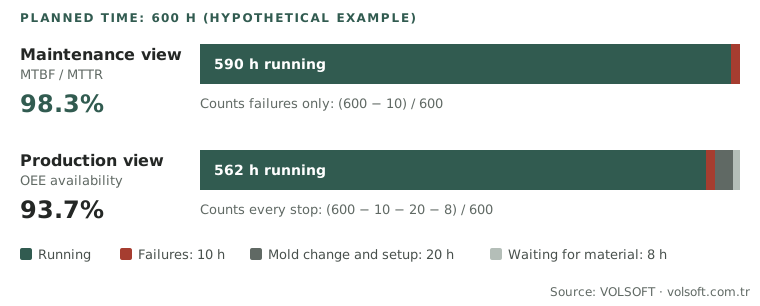
Back to our example. In the same month, on top of the failures, there were 20 hours of mold changes and setups and 8 hours of waiting for material. OEE availability is:
(600 − 10 − 20 − 8) / 600 = 562 / 600 = 93.7%
Use this diagram
You may use this diagram free of charge on your site, in training or in presentations, as long as you credit and link the source. The code below does both.
Availability is 98.3% from the maintenance point of view and 93.7% from the production point of view. Both are correct within their own scope; they simply count different kinds of stops. That is why a downtime tracking system needs to separate stops by reason: failures feed MTBF and MTTR, all stops feed OEE. If every stop is logged under a single “downtime” heading, neither metric can be calculated.
Common mistakes in MTBF and MTTR calculations
1. A vague definition of “failure”. If mold changes, material waits or planned maintenance are counted as failures, MTBF comes out far too low. Write down which stops count as failures (for example, “an unplanned stop that needs maintenance to intervene”).
2. Short failures are not recorded. Jams that operators clear themselves in a few minutes are often never logged, which makes MTBF look better than it is. Agree in advance below what duration stops are tracked separately.
3. No clear start and end for MTTR. If one plant measures MTTR from when the technician reaches the machine and another from when the failure starts, the two numbers cannot be compared. We recommend measuring MTTR from the start of the failure until the machine is back in production, and recording the waiting times within it separately.
4. Drawing conclusions from too few failures. On a machine with two failures a month, adding or removing a single failure can halve or double MTBF. For equipment that rarely fails, a longer period (a quarter or a year) is more meaningful.
5. Treating calendar time as run time. On a machine that runs two shifts, five days a week, counting the whole month (720 hours) as run time inflates MTBF. Run time should be derived from planned production time.
6. Calculating a whole line as one machine. Line-level MTBF can be a summary for management, but improvement needs to see which machine, and even which subsystem (hydraulic, electrical, mechanical), failed.
How to track MTBF and MTTR in Excel
To get started, a sheet with one row per failure is enough:
| Column | Example |
|---|---|
| Date | 14/10/2026 |
| Machine | Press-03 |
| Failure start | 10:20 |
| Reported to maintenance | 10:25 |
| Intervention start | 10:40 |
| Back in production | 12:05 |
| Failure group | Hydraulic |
| Description / work done | Pressure valve replaced |
From these rows:
- Repair time (hours) = (Back in production − Failure start) × 24
- Number of failures = by machine and period with
COUNTIF/COUNTIFS - Total repair time = by machine and period with
SUMIFS - MTTR = Total repair time / Number of failures
- MTBF = (Planned production time − Total repair time) / Number of failures
The calculation works in Excel, but the result is only as good as the recorded start and end times. Times are usually entered later and rounded, and short failures are not entered at all. When the machine’s running and stopped signal is read automatically from the PLC, start and end are recorded to the second and the operator or technician only picks the reason. MTBF and MTTR reports are then produced automatically from those records.
How to improve MTBF and MTTR
- For MTTR: automatic failure alerts, written diagnosis steps for frequent failures, critical spare parts kept in stock, and failure history the technician can see at the machine.
- For MTBF: root-cause analysis of repeat failures, planned maintenance intervals adjusted to the failure records, and predictive maintenance that watches the early signs of a failure (vibration, temperature, current, drift in cycle time).
Either way, the first step is the same: complete and accurate failure records.
From the field: what we often see with MTBF and MTTR
- Short failures never make it into the log. In hand-kept failure logs, interventions of a few minutes are usually not written down. Once stops are captured automatically from the machine, the failure count rises, MTBF drops and MTTR gets shorter; the numbers look worse, but they are showing the real picture for the first time.
- Write the definition of “failure” first. If mold changes, material waits or operator breaks count as failures, MTBF loses its meaning. In the downtime reason list we keep failure categories apart from planned stops and production-related waits.
- Splitting MTTR into its parts pays off. Keeping reporting, intervention, diagnosis, spare-part and repair times separate shows whether the delay sits in the maintenance work or in the organisation.
- Maintenance and production should look at the same data. Maintenance calculates availability from MTBF and MTTR, production from OEE. Producing both numbers from the same stop records ends the argument about whose figure is right.
Summary
MTBF shows how often a machine fails, MTTR how long it takes to fix a failure; together they give failure-related availability. Unlike OEE availability, they count failures only, so they let you see maintenance performance separately from production’s other losses. How reliable the calculation is depends less on the formula than on which stops count as failures, how repair time is measured and whether short failures are recorded.
Related guides: Predictive maintenance, Production tracking systems, What is MES.
To calculate with your own numbers, use our free MTBF and MTTR calculator, or download the failure log and MTBF/MTTR template (Excel).
With a system that collects failure and stop data automatically from the machine, MTBF, MTTR and OEE can all be calculated from the same records. We explain how to set this up in your plant on our MES and OEE implementation page, or you can talk to one of our engineers.